Ordovician sea–level changes: potential for global event stratigraphy
Arne Thorshøj Nielsen1
1 Geological Museum, University of Copenhagen, Øster Voldgade 5–7, DK–1350 Kbh K, Denmark. E–mail: Arnet@savik.geomus.ku.dk
Key words: Sea-level changes. Event stratigraphy. Correlation. Ordovician. Baltica.
Introduction
The Baltic–Russian continent, Baltica, lay at about 60ºS latitude in the Early Ordovician (e.g., Torsvik et al., 1996), but gradually moved northwards and entered the subtropical realm in the Late Ordovician. The craton was extensively flooded and as a result the clastic supply to the epicontinental sea was overall very limited. Along the western periphery the clastic supply increased from the Llanvirn onwards as a result of the ongoing closure of the Iapetus Ocean with development of a foreland basin adjacent to the rising Caledonide mountain belt (all references to British series are according to the definitions of Fortey et al., 1995). Following a phase of condensed clastic deposition during widespread dysoxic conditions in the early and mid Tremadoc, a cool–water carbonate platform was established in the Late Tremadoc. Average depositional rates were in the size order of a few mm per 1000 yrs. As the climate became warmer, carbonate production gradually increased with a marked hike during the Caradoc–Ashgill when warm–water type carbonates with reefs occur in shallow–water and carbonate secreting algae became widespread. However, because of the generally high sea levels during the Caradoc, deposition of cool–water carbonates still predominated in Baltoscandia across most of the drowned platform.
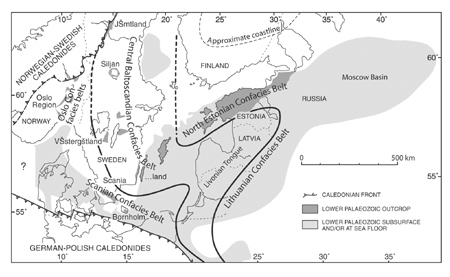
As a result of the extremely slow deposition in combination with almost quiescent tectonic conditions the sea level record essentially reflects eustasy, making the area ideal for the analysis of sea level changes (Nielsen, in press). The new sea level curve shown in Figure 2 is based on an analysis of sections across the Baltoscandian platform from the foreland basin of the Oslo area and deep outer shelf of Scania–Bornholm via the mid–shelf successions of Siljan and Västergötland to the relatively nearshore successions of Estonia (Nielsen, in press; for location of mentioned districts, see Figure 1). This approach ensures easy identification of gaps relating to lowstands in the nearshore locations and at the same time the relatively nearshore sections provide a better resolution for the highstand intervals, represented by relatively uniform mudstone successions on the outer shelf.
Event stratigraphy
Correlation of sea level changes has a significant potential for precise intercontinental correlation of the Ordovician, but so far this approach has received little attention. The new composite Baltoscandian curve (Figure 2) is believed to largely reflect eustasy and it may be a good starting point for sea level based global correlation. The Baltoscandian successions are also comparatively well–dated in terms of graptolite and conodont biostratigraphy, facilitating comparison with other areas. A correlation between Laurentia and Baltica, based on the sea level curves published by Ross and Ross (1992, 1995), is discussed by Nielsen (in press).
Figure 1. Generalised facies belts of Baltoscandia during the Mid and Late Ordovician. Present day distribution of Lower Palaeozoic rocks in Baltoscandia is also shown; originally they covered most of the region. Names of districts and countries referred to are indicated. From Nielsen (in press).
Below is outlined the main 2nd order sea level intervals, which provide a resolution comparable with that of the series level. Within such framework it might be possible to recognize the most major 3rd order events, which in particular for the Late Ordovician provides a stratigraphic resolution exceeding that of graptolite and conodont zones.
2nd order intervals
The 2nd order sea level pattern divides the Ordovician into three highstand and three lowstand intervals (Figure 2). This general pattern ought to be globally recognizable, even in tectonic active settings, since sea level exerts a strong control on clastic supply and carbonate production. The intervals are named according to age (Nielsen, in press): the Early–Mid Tremadoc highstand interval, the Late Tremadoc–earliest Arenig lowstand interval, the Early Arenig highstand interval, the Mid Arenig–Early Llanvirn lowstand interval, the Late Llanvirn–Caradoc highstand interval and the Ashgill lowstand interval.
Major 3rd order drowning events
The "Early–Mid Tremadoc highstand interval" includes the Stonehenge and Kiaerograptus drownings that ought to be widely recognizable. The composite nature of the former may, however, create problems for detailed correlation. Then followed the Hagastrand Drowning, which was a fairly marked drowning, but not as conspicuous as the prominent Billingen and Evae drownings, of which in particular the latter must have an excellent correlation potential. Also the Gärdlösa Drowning may be widely recognizable. No major drowning events are recognized in the "Mid Arenig–Early Llanvirn lowstand interval" except for the Basal Llanvirn Drowning. Then followed the extended "Late Llanvirn–Caradoc highstand interval" that was punctuated by three main 3rd order lowstand intervals (Vollen, Frognarkilen and Solvang). The sea level changes were gradual up to the early Caradoc Frognarkilen Lowstand, and no events can be pointed out, although the Furudal and Keila highstands must be recognizable elsewhere. Above the Frognarkilen Lowstand the sea level changes became more rapid and of large magnitude and here the major Nakkholmen and Linearis drownings have excellent potential for correlation, although the composite nature of the Linearis drownings may create problems for detailed stratigraphy.
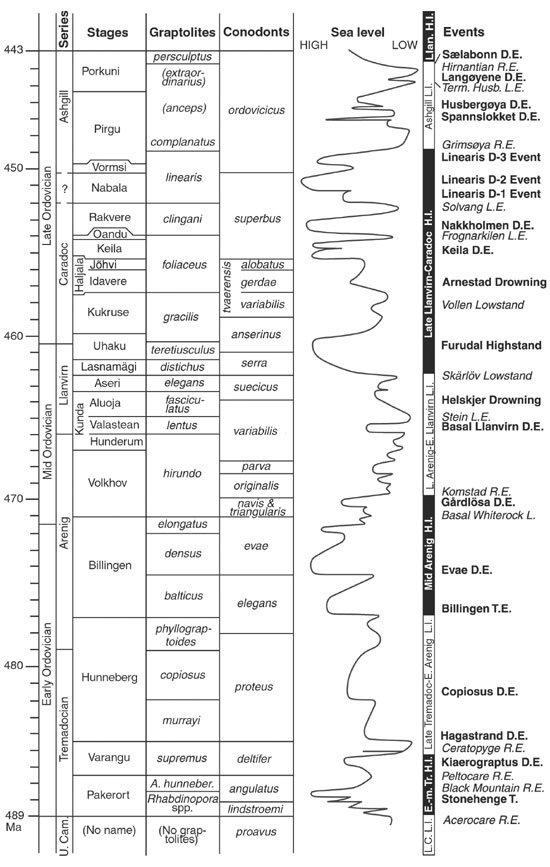
Figure 2. Sea level curve for the Ordovician of Baltoscandia plotted against the standard stratigraphy outlined by Webby et al (in press), except that the Keila and Oandu Stages are correlated with the foliaceus Zone. Drownings and highstands are shown in bold, lowstands and shoalings in italics. (Slightly modified from Nielsen, in press).
The Linearis highstands were terminated by the profound Grimsøya Regressive Event. The Ashgill was a 2nd order lowstand interval, of which at least the later part has been connected with glaciations in Gondwana. I would assume that the entire 2nd order lowstand was glacio–eustatic. It was punctuated by the Spannslokket, Husbergøya and Langøyene drownings of successively lower amplitudes. The Spannslokket Drowning was rather short–lived, and the longer lasting Husbergøya Drowning therefore has a better correlation potential, albeit being of slightly smaller amplitude.
Major 3rd order lowstand events
The large–scale CRE, Frognarkilen, Solvang, Grimsøya and Hirnantian shallowing events have prominent correlation potential, whereas the progressive shallowings during the early Mid Ordovician presumably will prove difficult to correlate due to the composite nature of this lowstand interval within which the Stein Lowstand represents lowest sea level. The early Late Ordovician Vollen Lowstand, which is not referred to as an event, also ought to be widely traceable. It might be noted that it spans the bulk of the gracilis Zone, suggesting that the so–called gracilis transgression (Fortey, 1984) is a misnomer for the general Caradoc sea level rise, starting in the foliaceus Zone (Arnestad Drowning).
Conclusions
The correlation of sea level changes has a vast but as yet essentially untapped potential for improving the correlation of Ordovician successions around the world. An insight into sea level changes also provides an improved understanding of the traditional bio– and lithostratigraphic correlations and some pitfalls may be avoided. It is in this context stressed that highstand events are easier to correlate in terms of biostratigraphy, because the relatively more widely distributed deep–water faunas (graptolites/conodonts) impinged onto the shelves. A quick glance at the sea level chart also indicates a clear tendency for adaptive radiations among graptolites to match drowning events; this trend may also be valid for other groups. Lowstands leave conspicuous marks in the shelfal sedimentary record, and were originally the primary tool for correlation of depositional sequences (Vail et al., 1977). However, shallow water faunas tend to be endemic and are therefore notoriously difficult to correlate. These basic differences between low– and highstands were discussed already by Fortey (1984), but despite the fundamentally different correlation potential, no philosophy about sea level changes has been formulated regarding intercontinental chronostratigraphic correlation of the Ordovician. In this perspective it is a matter of concern that the base of the Middle Ordovician has been suggested at the base of an extended, composite lowstand, wherefore biostratigraphic correlation might be anticipated to prove difficult. To some extent the same may be said for the base of the Upper Ordovician, which, however, in detail seems to tie in with the terminal part of the Furudal Highstand (Nielsen, in prep.) and thus may be anticipated to have a better potential for widespread bio–based correlation.
References
Fortey, R. A, 1984: Global earlier Ordovician transgressions and regressions and their biological implications. In: Bruton, D.L. (ed.): Aspects of the Ordovician System. Palaeontological Contributions from the University of Oslo 295. Universitetsforlaget: 37–50.
Fortey, R.A., Harper, D.A.T., Ingham, J.K., Owen, A.W. and Rushton, A.W.A., 1995: A revision of Ordovician series and stages from the historical type area. Geological Magazine, 132: 15–30.
Nielsen, A.T., in press: Sea–level Changes – a Baltoscandian Perspective. In: Webby, B., Droser, M, Paris, F. and Percival, I. (Eds.): "The Great Ordovician Biodiversification Event", Part II. Conspectus of the Ordovician world. Columbia University Press volume.
Ross, J.R.P. and Ross, C.A., 1992: Ordovician sea–level changes. In: Webby B.D.and Laurie J.R. (Eds.): Global Perspectives on Ordovician Geology. Balkema, Rotterdam: 327–344.
Ross, C. A. and Ross, J.R.P., 1995: North American depositional sequences and correlations. In: Cooper, J.D., Droser, M.L. and Finney, S.C. (Eds.): Ordovician Odyssey: Short papers for the Seventh International Symposium on the Ordovician System. Pacific Section Society for Sedimentary Geology (SEPM). Fullerton, California, USA: 309–313.
Torsvik, T.H., Smethurst, M.A., Meert, J.G., Van der Voo, R., McKerrow, W.S., Brassier, M.D., Sturt, B.A. and Walderhaug, H.J., 1996: Continental break–up and collision in the Neoproterozoic and Palaeozoic – A tale of Baltica and Laurentia. Earth–Science Reviews, 40: 229–258.
Vail.P.R., Mitchum, R.M. Jr., Todd, R.G., Widmier, J.M., Thompson, S., Sangree, J.B., Bubb, J.N. and Hatlelid, W.G., 1977: Seismic Stratigraphy and Global Changes of Sea Level. In: Payton, C.E. (ed.): Seismic Stratigraphy – applications to hydrocarbon exploration. American Association of Petroleum Geologists Memoir, 26: 49–212.
Webby, B.D., Cooper, R.A., Bergström, S.M– and Paris, F., in press: Stratigraphic Framework and Time Slices. In: Webby, B., Droser, M, Paris, F. and Percival, I. (Eds.). "The Great Ordovician Biodiversification Event", Part I: Scaling of Ordovician time, and measures for assessing biodiversity change. Columbia University Press volume.
Received: February 15, 2003
Accepted: June 15, 2003